MugArchive
A web application to catalog my Starbucks Discovery Series ornaments collection
A Map That Holds My Collection Story
Some collections are about rarity; others are about places. For me, the Starbucks Discovery Series Ornaments collection belongs to the second type. Each piece is tied to a location, and over time the collection becomes a quiet record of where I have been and the memories attached to each stop. As the collection grew, I realized a simple list was not enough. I wanted something visual and instantly understandable. I wanted to see patterns, gaps, and progress at a glance. That is why I built MugArchive.
Why a Grid First Experience Works Better
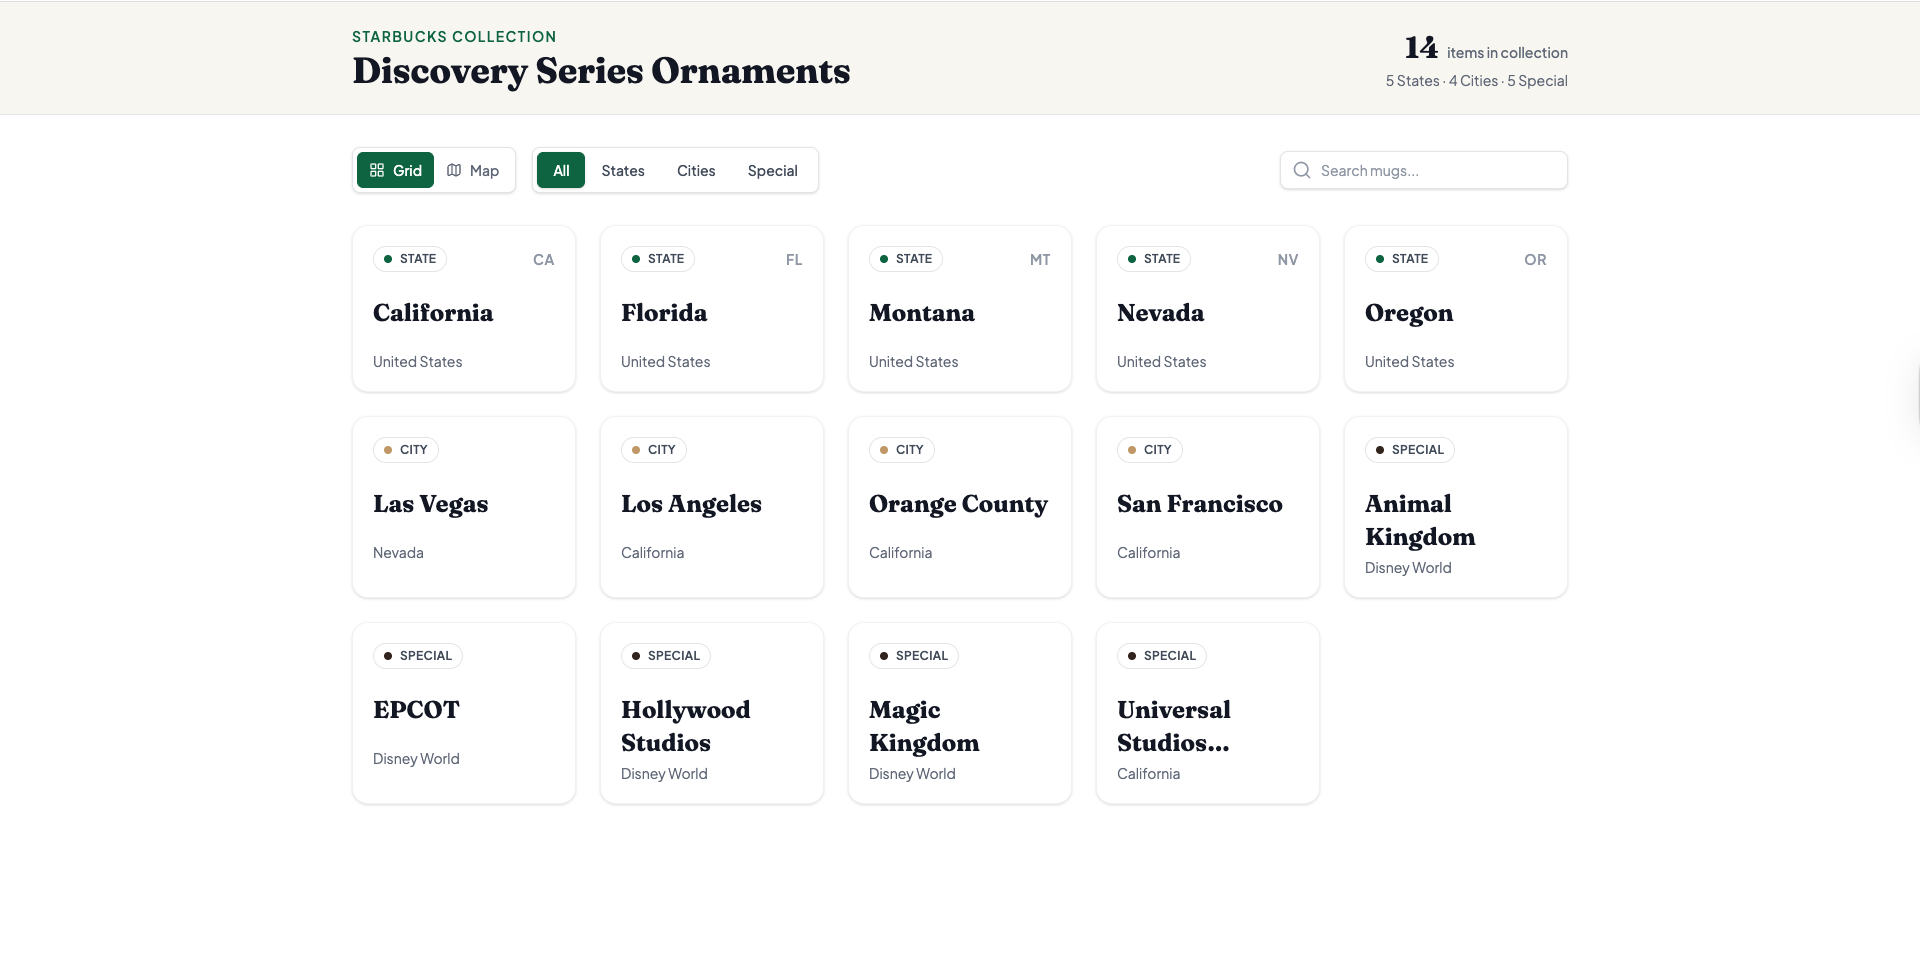
As the collection grew, I realized most of the time I did not want a map first. I wanted a calm catalog where I could scan items quickly, search by name, and filter by category. That is why MugArchive opens in a grid view by default. It feels like flipping through an organized collection book, not navigating a tool. The grid makes the archive easy to maintain and easy to revisit. When I want speed and structure, the grid is the best place to start.
When the Map Becomes the Second Perspective
A map still matters for this collection because location is the meaning behind many items. The map view is where the archive becomes more visual. It helps me understand the distribution across the United States, notice gaps, and explore by region. In MugArchive, the grid is for browsing and organizing. The map is for exploring patterns and places. Switching between the two is meant to be effortless so I can choose the view that fits the moment.
Categories That Match How Collectors Think
To keep things simple and consistent, MugArchive organizes items into three categories.
- States
- Cities
- Special items
Special items are for locations that do not fit the usual state or city framing. For example, theme park locations such as Disney World parks. This keeps the archive flexible without making it complicated.
A Collection Dashboard at a Glance
Beyond the grid and the map, MugArchive keeps a small dashboard in the header showing the total item count and a breakdown by category. It is a quick way to check progress without scrolling through the whole archive, and it updates instantly as the search and filter state changes.
Designing for Real Life
I built MugArchive for the situations where I actually use it:
- Browsing on a desktop when I want to compare items calmly
- Using a phone when I need quick search and quick filtering
- Sharing the site with a friend who just wants to understand what the project is at a glance
That is why the UI stays lightweight, responsive, and focused on a clean reading experience. The goal is not to overwhelm the user with controls. It is to make the collection feel organized and enjoyable.
How I Keep MugArchive Updated
The frontend stays a static site on GitHub Pages, but the collection data itself now lives in a Supabase Postgres table and is fetched at runtime (with realtime updates), so I can add a new mug without rebuilding or redeploying the site. There is no in-app write UI or auth by design: I edit the mugs table directly in Supabase Studio, which is protected by a read-only Row Level Security policy — only select is allowed, so there is no insert/update/delete path even if the anon key were misused.
src/data/mugs.js still exists as the source dataset, but its role has changed: it is the seed source for scripts/seed.mjs, which populates the Supabase table, and it doubles as an offline fallback the app renders from if Supabase is unconfigured or unreachable. Category still determines the required fields:
-
Stateneeds justid(a two-letter state code) andname -
CityneedsstateId,lat, andlonso the marker appears correctly on the map -
Specialneedslatandlon;groupis optional and clusters related entries, such as “Disney World”, into a single marker
Here are simplified examples that match the current data structure:
// State
{
  id: "CA",
  name: "California",
  category: "State"
}

// City
{
  id: "san-francisco",
  name: "San Francisco",
  category: "City",
  stateId: "CA",
  lat: 37.774929,
  lon: -122.419418
}

// Special item
{
  id: "disney-world-epcot",
  name: "EPCOT",
  category: "Special",
  group: "Disney World",
  stateId: "FL",
  lat: 28.3747,
  lon: -81.5494
}
If I ever change the dataset in a way that should also change the fallback, I keep src/data/mugs.js in sync and re-run the seed script so the table matches it again.
The Tech Behind the Experience
MugArchive pairs a static front end with a lightweight managed backend, so it stays simple to run while no longer being limited to data baked into the build.
- React 19 renders the catalog views and UI state
- Vite 7 provides a fast development and build workflow
- Tailwind CSS v4 keeps the layout and typography consistent across pages, configured directly through the Vite plugin with no separate config file
- Supabase hosts the mug data in Postgres and exposes it through its auto-generated REST/realtime API, gated by a read-only RLS policy
- Lucide React adds clean icons for controls and navigation
- ESLint enforces code quality as the dataset expands
Why MugArchive?
Because a collection is more than a list. It is a pattern across places, a set of memories, and a long-term project that grows quietly. MugArchive is my way of keeping that story organized, visible, and enjoyable to revisit.
Notes and Attribution
- The base SVG map is sourced from amCharts SVG Maps.
- Starbucks Discovery Series is a trademark of Starbucks Corporation.